File: Carbon Dioxide 400kyr.png
Carbon_Dioxide_400kyr.png (512 × 380 pixels, file size: 22 KB, MIME type: image/png)
Description
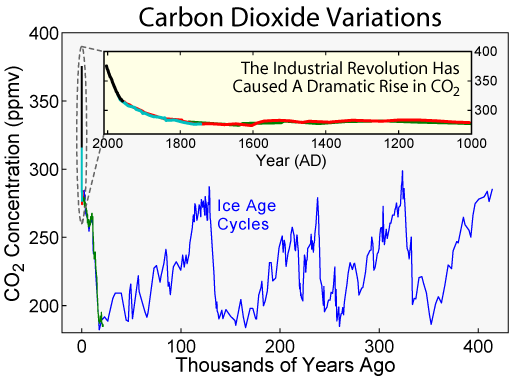
This figure shows the variations in concentration of carbon dioxide (CO2) in the atmosphere during the last 400 thousand years. Throughout most of the record, the largest changes can be related to glacial/interglacial cycles within the current ice age. Although the glacial cycles are most directly caused by changes in the Earth's orbit (i.e. Milankovitch cycles), these changes also influence the carbon cycle, which in turn feeds back into the glacial system.
Since the Industrial Revolution, circa 1800, the burning of fossil fuels has caused a dramatic increase of CO2 in the atmosphere, reaching levels unprecedented in the last 400 thousand years. This increase has been implicated as a primary cause of global warming.
Copyright
This figure was prepared by Dragons flight from publicly available data and is released under the GFDL.

|
Permission is granted to copy, distribute and/or modify this document under the terms of the GNU Free Documentation License, Version 1.2 or any later version published by the Free Software Foundation; with no Invariant Sections, no Front-Cover Texts, and no Back-Cover Texts. A copy of the license is included in the section entitled "Text of the GNU Free Documentation License." |
Data Sources
- (blue) Vostok ice core: Fischer, H., M. Wahlen, J. Smith, D. Mastroianni, and B. Deck (1999). Ice core records of Atmospheric CO2 around the last three glacial terminations. Science 283: 1712-1714.
- (green) EPICA ice core: Monnin, E., E.J. Steig, U. Siegenthaler, K. Kawamura, J. Schwander, B. Stauffer, T.F. Stocker, D.L. Morse, J.-M. Barnola, B. Bellier, D. Raynaud, and H. Fischer (2004). Evidence for substantial accumulation rate variability in Antarctica during the Holocene, through synchronization of CO2 in the Taylor Dome, Dome C and DML ice cores. Earth and Planetary Science Letters 224: 45-54. Digital object identifier (DOI): 10.1016/j.epsl.2004.05.007
- (red) Law Dome ice core: D.M. Etheridge, L.P. Steele, R.L. Langenfelds, R.J. Francey, J.-M. Barnola and V.I. Morgan (1998) "Historical CO2 records from the Law Dome DE08, DE08-2, and DSS ice cores" in Trends: A Compendium of Data on Global Change. Carbon Dioxide Information Analysis Center, Oak Ridge National Laboratory, U.S. Department of Energy, Oak Ridge, Tenn., U.S.A.
- (cyan) Siple Dome ice core: Neftel, A., H. Friedli, E. Moor, H. Lötscher, H. Oeschger, U. Siegenthaler, and B. Stauffer (1994) "Historical CO2 record from the Siple Station ice core" in Trends: A Compendium of Data on Global Change. Carbon Dioxide Information Analysis Center, Oak Ridge National Laboratory, U.S. Department of Energy, Oak Ridge, Tenn., U.S.A.
- (black) Mauna Loa Observatory, Hawaii: Keeling, C.D. and T.P. Whorf (2004) "Atmospheric CO2 records from sites in the SIO air sampling network" in Trends: A Compendium of Data on Global Change. Carbon Dioxide Information Analysis Center, Oak Ridge National Laboratory, U.S. Department of Energy, Oak Ridge, Tenn., U.S.A.
Related images
Solar variation and greenhouse gases during 420,000 years.
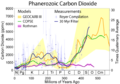
Carbon dioxide variations during the last 550 million years.


File history
Click on a date/time to view the file as it appeared at that time.
| Date/Time | Thumbnail | Dimensions | User | Comment | |
|---|---|---|---|---|---|
| current | 16:52, 2 October 2005 | | 512 × 380 (22 KB) | David Burton (talk | contribs) | __NOTOC__ == Description == This figure shows the variations in concentration of carbon dioxide (CO<sub>2</sub>) in the atmosphere during the last 400 thousand years. Throughout most of the record, the largest changes can be related to glacial/ |
You cannot overwrite this file.
File usage
The following page uses this file: